90% Loss in Dilute Assays for Labs: Stop Peptide Adsorption to Plastic
September 18, 2026 · STEPHAN ZOHAR

The PLoS ONE 2015 study documented that magnitude for mastoparan X, melittin, and magainin 2 in ordinary polypropylene and glass containers. Hydrophobic patches and charged residues drive most of the loss, and the fix is a mix of low-bind labware, fewer transfers, and analytical verification with HPLC or LC-MS. Every peptide behaves differently, so test recovery in your own buffer and vessel before trusting a number from someone else’s paper.
TL;DR:
- Peptide loss to container surfaces can reach 90% or more for some cationic peptides, especially at low concentrations and in high surface-area formats like microplates.
- Hydrophobic residues predominantly drive adsorption to plastics, while electrostatic attractions attract cationic peptides to glass, making specific amino acid composition a key predictor of surface loss.
- Using low-binding or plasma-treated microplates significantly improves recovery at low nanomolar concentrations, but no material guarantees complete resistance for every peptide.
- Minimizing transfers, diluting in larger volumes, and performing spike-and-recovery tests for each peptide and buffer combination are essential to accurately quantify and mitigate adsorption losses.
- Verified peptides with third-party analysis and consistent handling practices provide the most reliable baseline for adsorption assessments and experimental reproducibility.
Table of Contents
- How Large Is the Problem: Quantitative Evidence and Experimental Impacts
- Mechanisms: Why Peptides Stick to Plastic and Glass
- Which Labware and Consumables to Use or Avoid
- Assay Design and Handling Practices That Reduce Adsorption-Driven Loss
- How to Detect and Measure Adsorption in Your Workflow
- Consolidated Checklist and Protocol for Preparing Dilute Working Solutions
- Neo Lab Peptides: Reducing Experimental Variables Through Verified Material
- Three Habits That Prevent Most Adsorption Losses
- Where to Get Verified Peptides and Handling Support
- Primary Literature and Protocol Resources to Consult Next
- Sources
- FAQ
How Large Is the Problem: Quantitative Evidence and Experimental Impacts
The scale of peptide loss to plastic surprises even experienced bench scientists the first time they run a spike-and-recovery check. Researchers behind the PLoS ONE study used analytical HPLC to quantify how much of three well-characterized cationic peptides remained in solution after incubation in glass and polypropylene vessels.
That number isn’t an outlier tied to one exotic peptide chemistry. It reflects a broader pattern: any peptide with a strong net positive charge or an exposed hydrophobic face is a candidate for severe surface loss, especially at low concentration.
Statistic Callout: Some cationic peptides lose 90% or more of their starting concentration to glass and plastic surfaces under standard laboratory handling, according to HPLC-based recovery data from controlled adsorption experiments.
Concentration and surface-area-to-volume ratio explain why the same peptide can look “fine” in one experiment and vanish in another. A peptide stock at 100 micromolar in a 15 mL conical tube has a tiny fraction of its total mass exposed to the wall relative to the molecules in the bulk solution. Dilute that same peptide to 10 nanomolar in a 200 microliter microplate well, and the ratio of wetted surface to peptide mass increases by several orders of magnitude. The wall now competes far more effectively for the available peptide, and fractional loss climbs sharply even though the total surface area in absolute terms is smaller.
This is also why measured recovery in a large vial rarely predicts what happens in a microplate well or an autosampler vial insert. Three vessel types illustrate the pattern clearly:
- Standard 96-well polystyrene plates at low nanomolar peptide concentrations frequently show the steepest fractional losses because the well surface area is large relative to the tiny working volume.
- Glass HPLC vials and cuvettes carry silanol groups on the surface that attract cationic peptides electrostatically, producing losses that rival or exceed some plastics even though glass is often assumed to be inert.
- Larger polypropylene tubes and reservoirs used for stock storage generally show the smallest fractional loss because the bulk peptide mass overwhelms the fixed number of binding sites on the wall.
The practical takeaway is that a recovery number from a stock tube tells you almost nothing about what will happen once that peptide gets diluted into a low-volume assay format. Each dilution step and each new vessel resets the surface-to-volume math, and each reset is a fresh opportunity for loss.
Mechanisms: Why Peptides Stick to Plastic and Glass
Peptide adsorption to plastic surfaces isn’t a single phenomenon. It’s the sum of at least two distinct physical forces, and knowing which one dominates for your peptide changes how you should mitigate it.
The hydrophobic effect drives adsorption to polypropylene and polystyrene. Both polymers present nonpolar surfaces, and any peptide segment with exposed hydrophobic residues (leucine, valine, phenylalanine, tryptophan) finds it energetically favorable to escape the aqueous environment and associate with that surface. Van der Waals interactions reinforce this once the peptide backbone gets close enough to the polymer chains, effectively locking the molecule in place. Molecular dynamics work on polyethylene surfaces confirmed that bulky hydrophobic residues form dense, high-affinity coronas on plastic, essentially wrapping the surface in a layer of adsorbed peptide that can be difficult to displace.
Electrostatic attraction explains why glass, despite its reputation as an inert material, causes serious losses for a specific class of peptides. Borosilicate and soda-lime glass both expose silanol (Si-OH) groups at the surface, and at physiological pH these groups carry a net negative charge. Any peptide with an excess of arginine or lysine residues, common in antimicrobial and membrane-active peptide families, gets pulled toward that negatively charged surface through simple electrostatic attraction. This is why “just switch to glass” is bad advice for cationic peptides specifically, even though it can help with certain hydrophobic sequences that stick worse to plastic.
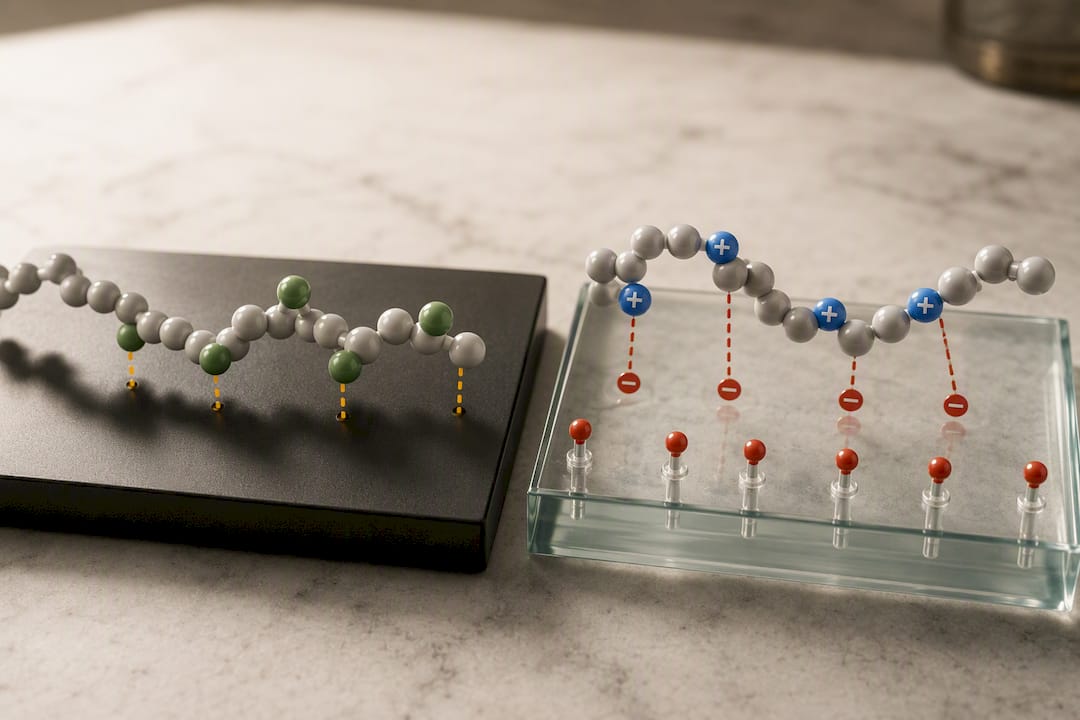
Sequence composition, not just net charge, predicts adsorption strength with real precision. Computational and experimental work on peptide corona formation on polyethylene found that residues like valine, tyrosine, and tryptophan tend to anchor strongly to plastic surfaces, while arginine-rich sequences without balancing hydrophobic content show comparatively weaker adsorption to plastic (even as they adsorb strongly to glass through the electrostatic route). Follow-up design work using MD-informed modeling reached a similar conclusion: adsorption free energy correlates with the presence of bulky hydrophobic residues, and that relationship holds well enough to guide peptide engineering decisions when adsorption resistance actually matters for an experiment.
A few practical rules follow directly from the mechanism:
- Peptides with amphipathic helical structure (a hydrophobic face and a charged face) are at the highest combined risk, since they can adsorb to plastic through one face and to glass through the other.
- Highly charged, low-hydrophobicity peptides (many phosphopeptides, for instance) tend to show milder adsorption to plastic but can still bind glass electrostatically.
- Short, hydrophilic peptides with no strongly hydrophobic stretch are the closest thing to “adsorption-resistant,” but almost no peptide is fully immune at nanomolar concentrations.
Pro Tip: If you don’t know your peptide’s adsorption behavior, run a quick BLAST-style scan of its sequence for hydrophobic stretches and net charge before you design the assay. A peptide that’s both cationic and hydrophobic in different regions deserves low-bind plastic, a blocking strategy, and a recovery check before you trust a single data point from it.
Which Labware and Consumables to Use or Avoid
Material choice is the first lever most labs pull, and it’s the one with the clearest evidence behind it, though the evidence also comes with real caveats worth understanding before you assume any product solves the problem outright.
Borosilicate glass behaves inconsistently depending on peptide chemistry. It resists many hydrophobic small molecules well, but its silanol-rich surface makes it a poor choice for cationic peptides, where electrostatic adsorption can rival the losses seen on untreated plastic.
Standard polypropylene, the default material for most disposable tubes and pipette tips, adsorbs hydrophobic and amphipathic peptides through the van der Waals mechanism described above. It’s cheap and chemically inert in most other respects, which is exactly why it’s everywhere in a typical lab, and exactly why it’s easy to overlook as a source of unexplained signal loss.
Polystyrene, the material behind most standard microplates and many disposable pipette components, tends to show some of the highest fractional losses for peptides at low concentration, largely because polystyrene plates are almost always used in the low-volume, high-surface-area format where the surface-to-volume math is already working against you.
Low-binding (LoBind) products, like Eppendorf Protein LoBind tubes and Eppendorf LoBind microplates, use a modified polypropylene surface chemistry designed to reduce nonspecific binding of proteins and peptides. These products genuinely reduce adsorption for many peptides relative to standard polypropylene, and they’ve become close to a default recommendation for dilute peptide work.
Plasma-treated ultra-low-binding microplates, such as PureWARE™ Ultra-Low Binding plasma-treated microplates, take a different approach: rather than relying on a bulk polymer additive, the plate surface itself is modified through plasma treatment to reduce peptide affinity. A study comparing plasma-treated ULB microplates against standard polypropylene found dramatically better recovery at low concentration. The same research found plasma-treated plates maintained strong recovery over extended storage, and outperformed some commercial low-bind microplates for specific peptides, including insulin and glucagon, in the low-nanomolar range.
That result is genuinely useful, but it comes with a limit worth stating plainly: no single labware surface universally solves adsorption for every peptide. The same PLoS ONE research that quantified the 90% loss numbers also found that low-bind plastics helped some peptides substantially while barely moving the needle for others, depending on the specific balance of hydrophobic and charged residues in that peptide’s sequence.
A handful of consumables deserve extra scrutiny because researchers tend to overlook them:
- Syringe barrels, especially plastic syringes used for small-volume dosing or dilution, present a surprisingly large wetted surface relative to the volume they hold, and peptide loss during syringe transfer is a common, underdiagnosed source of variability.
- Filter membranes used for sterile filtration can adsorb a meaningful fraction of peptide, particularly at low starting concentration, and the loss is easy to mistake for degradation or poor stock stability.
- Pipette tips, especially when used repeatedly for serial dilution without pre-wetting, contribute cumulative loss that adds up fast across a dilution series.
- Standard polystyrene assay plates used for the final readout step, where surface-to-volume ratio is often at its worst point in the entire workflow.
The decision rule that holds up best across peptide classes: default to LoBind tubes and plates for any peptide you haven’t previously validated, treat plasma-treated ULB plates as the stronger option specifically for very low concentration work, and run your own spike-and-recovery test before assuming any surface, including a certified low-bind product, fully solves your specific peptide’s adsorption problem.
Assay Design and Handling Practices That Reduce Adsorption-Driven Loss
Material choice only gets you partway there. The way you handle a peptide solution, how many times you move it, and how you dilute it matters just as much, and in some cases matters more than the labware itself.
The single highest-impact change most labs can make is minimizing the number of transfers between vessels. Every pipetting step introduces a new wetted surface, whether it’s a fresh tip, a new tube, or a new well, and each one takes a bite out of your peptide concentration. Practitioner reviews on peptide loss describe adsorption as fundamentally a surface-area-limited process, which means the total wetted area you expose the peptide to across an entire protocol, not any single step, determines your cumulative loss.
Here’s a practical sequence for reducing that cumulative exposure:
- Plan your dilution series backward from the final assay concentration, and figure out the minimum number of steps needed to get there, rather than defaulting to a familiar serial 1:10 series out of habit.
- Use larger intermediate volumes wherever possible. A single dilution from stock into a larger intermediate tube, followed by one more step into the assay plate, usually loses far less peptide than three or four smaller serial steps.
- Avoid diluting into the final low-volume format until the last possible step. Do your dilution math in larger tubes and only move into the microplate well or cuvette once the peptide is at (or very near) its final working concentration.
- Pre-wet tips and tubes with a blank buffer pass when repeated transfers through the same consumable are unavoidable, since a saturated surface adsorbs less on subsequent contact.
- Keep total contact time short. Adsorption is a time-dependent equilibrium process, so minimizing how long a dilute peptide solution sits in a given vessel before use reduces the fraction lost to the wall.
Blocking agents and carrier molecules offer another layer of protection, though each comes with a compatibility tradeoff you need to think through before adding it to your protocol. Nonionic surfactants like Tween-20, added at low concentration, can compete with peptide for surface binding sites and meaningfully reduce adsorption, but they can also interfere with downstream mass spectrometry or certain binding assays, so check compatibility first. Bovine serum albumin (BSA), added as a carrier protein, works similarly by saturating available binding sites, though it obviously isn’t an option for any assay that quantifies total protein or relies on a clean peptide-only matrix. Anionic lipid vesicles represent a more elegant option specifically for cationic membrane-active peptides: research on cationic peptide adsorption found that adding carrier lipids or vesicles could partition the peptide away from container walls entirely, dramatically cutting adsorption for peptides that would otherwise stick heavily to glass or plastic.
Presaturation, deliberately coating a vessel’s surface with peptide before adding your working solution, sounds like an obvious fix, and it can reduce initial adsorption in some workflows. But the same PLoS ONE research that established the adsorption magnitude also documented a real risk with this approach: a presaturated surface can act as a reservoir that releases adsorbed peptide back into solution when conditions change, such as when lipids or detergents get added later in the protocol. That release can quietly inflate your apparent peptide concentration at exactly the wrong moment. Use presaturation only when you’ve validated that your specific downstream steps won’t disturb the adsorbed layer, and never assume it’s a set-and-forget solution.
Pro Tip: If your protocol calls for a lipid or detergent addition step after peptide dilution, run a control without lipid addition to check whether your “recovery improvement” is actually presaturation release rather than genuine reduced binding. It’s an easy artifact to miss and an easy one to catch with one extra tube.
How to Detect and Measure Adsorption in Your Workflow
You can’t manage what you haven’t measured, and adsorption to plastic is exactly the kind of loss that hides inside “noisy” or “inconsistent” data until someone runs the right control.
The gold-standard approach is a spike-and-recovery experiment paired with analytical HPLC quantification. The design is straightforward: prepare a known concentration of your peptide in the exact buffer, vessel, and handling sequence your real assay uses, incubate it for the same duration your protocol calls for, then measure how much peptide is actually recoverable in solution against a matched calibration curve. Run this in parallel with a “zero-time” control that gets measured immediately after preparation, since comparing the incubated sample against that immediate baseline, rather than against the theoretical spiked concentration, isolates adsorption loss from any preparation error.
Statistic Callout: Losses measured this way in the PLoS ONE cationic peptide study reached 90% or more for some peptides, a number that only became visible because the researchers measured actual recovered concentration by HPLC rather than assuming nominal concentration held steady.
Percent recovery is calculated as (measured concentration after handling ÷ nominal or zero-time concentration) × 100. A few interpretation notes matter here:
- Recovery below 100% that stays constant across a concentration range usually points to reversible, non-saturating adsorption, meaning a fixed fraction sticks regardless of how much peptide you start with.
- Recovery that improves as concentration increases signals a saturable binding process. The wall has a finite number of binding sites, and once they’re occupied, additional peptide stays in solution. This is common and helps explain why dilute samples suffer disproportionately.
- Recovery that drops unexpectedly after a lipid, detergent, or matrix change may indicate presaturation release rather than a measurement artifact, as discussed above.
For LC-MS-based workflows specifically, the autosampler vial and any insert deserve particular attention. Method development work on Evosep-based chemical proteomics found that optimized sample handling, including deliberate ware selection and reduced transfer steps, measurably improved peptide recovery and sensitivity. Because autosampler vials often hold very small volumes for extended periods before injection, they can become a dominant, easily overlooked source of loss precisely when you’re chasing maximum sensitivity. If your LC-MS sensitivity drops unexpectedly, testing the vial and insert combination before troubleshooting the instrument itself can save real time.
Consolidated Checklist and Protocol for Preparing Dilute Working Solutions
A short, repeatable protocol beats an elaborate one that nobody follows consistently. Here’s a stepwise approach built around minimizing transfers and validating recovery at the point that matters.
Reconstitution through final assay protocol:
- Reconstitute lyophilized peptide according to the supplier’s documented volume and diluent guidance, and gently mix rather than vortex aggressively.
- Store the reconstituted stock at the concentration and vessel type validated for stability, following documented storage conditions for your specific peptide class.
- Plan the dilution path from stock to final assay concentration in as few steps as the required volumes allow.
- Perform the first dilution into a larger intermediate volume using low-bind tubes, and mix by gentle inversion rather than pipette-mixing against the wall.
- Transfer directly from the intermediate dilution into the final assay plate or vessel, avoiding any additional intermediate step.
- Minimize the time between final dilution and use in the assay.
Pipetting and transfer checklist:
- Choose LoBind tubes and plates by default for any unvalidated peptide, and reserve plasma-treated ULB plates for low-nanomolar work.
- Pre-wet tips with buffer before the working transfer when using the same tip repeatedly.
- Keep mixing gentle; aggressive vortexing can increase peptide exposure to air-liquid and vessel-liquid interfaces.
- Track incubation time at each step, since adsorption is time-dependent and longer holds mean more loss.
Quick troubleshooting and verification:
| Check | What to measure | What it tells you |
|---|---|---|
| Zero-time vs. incubated recovery | HPLC peak area or concentration | Isolates adsorption loss from prep error |
| Recovery across a concentration range | Percent recovery at 3+ concentrations | Reveals saturable vs. constant-fraction adsorption |
| Recovery with and without blocking agent | Percent recovery, paired samples | Confirms whether surfactant/BSA/lipid addition helps your peptide specifically |
| Recovery in final assay vessel vs. stock tube | Percent recovery, same peptide | Shows how much the low-volume step is costing you |
Neo Lab Peptides: Reducing Experimental Variables Through Verified Material
Adsorption studies work because researchers know exactly what concentration they started with. That certainty is harder to get when the starting material itself carries unknown purity or an undocumented history.
Neo Lab Peptides publishes third-party Certificates of Analysis with every lot, verified through HPLC and mass spectrometry testing, so the nominal concentration and purity you calculate your dilution series from is actually grounded in independent analytical confirmation rather than a label claim. That matters directly for adsorption work: if you don’t know your true starting purity, you can’t distinguish genuine surface loss from a peptide that was already below stated concentration before it left the vial.
Beyond the certificates, several handling resources support the practices covered above. The peptide storage conditions guide covers temperature and vial recommendations relevant to minimizing degradation alongside adsorption. The vial handling guide walks through reconstitution and transfer steps that reduce unnecessary contact with high-surface-area consumables. The reconstitution calculator helps plan dilution paths with fewer steps, which, as the handling section above lays out, is one of the most reliable ways to cut cumulative adsorption loss across a protocol.
Starting from a peptide with documented, third-party-verified purity removes one major confounding variable from any adsorption or recovery experiment. It doesn’t eliminate surface loss, but it means the loss you measure is real, and not an artifact of uncertain starting material.
Three Habits That Prevent Most Adsorption Losses
Most labs treat peptide adsorption as an occasional nuisance rather than a default assumption, and that’s backward. The peptides most likely to disappoint you experimentally, cationic, amphipathic, membrane-active sequences, are also the peptides most researchers are actively working with right now.
Three habits do most of the work. First, verify recovery empirically for every new peptide and matrix combination rather than assuming a published number transfers to your setup. Second, minimize transfers relentlessly. Every extra tube or well is a fresh binding surface, and cumulative loss across a sloppy dilution series often dwarfs anything a better tube material could fix. Third, treat low-bind and plasma-treated ware as a strong default, not a guarantee.
That third point is where I see labs get overconfident. LoBind tubes and ultra-low-binding plates are genuinely better than standard polypropylene for many peptides, but “many” isn’t “all.” A peptide with an unusual charge distribution or an atypical hydrophobic patch can still stick badly to a surface engineered to resist most peptides. The only way to know for sure is the HPLC recovery check, every time, for every new peptide.
— Stephan
Where to Get Verified Peptides and Handling Support
Running a clean spike-and-recovery experiment starts with knowing exactly what you put into the tube. Verified peptide providers often ship lots with third-party Certificates of Analysis backed by HPLC and mass spectrometry testing, so recovery numbers can reflect real adsorption behavior rather than uncertainty about starting purity.

If you’re validating an assay against a peptide known for adsorption issues, membrane-active and cationic sequences among them, running your own spike-and-recovery test against a verified standard gives you a baseline you can trust before you commit to a full experimental series. Neo Lab Peptides’ Growth Hormone and Healing & Recovery categories cover several peptide classes worth testing against your own labware and handling protocol, and the full catalog of research peptides and lab supplies includes documentation to support that kind of verification work from the start. Pull a lot-specific COA, run your own recovery check with your chosen tubes and plates, and build your handling protocol around real numbers rather than assumptions borrowed from a different lab’s peptide.
Primary Literature and Protocol Resources to Consult Next
For a deeper dive into the data behind the guidance above, these primary sources are worth reading directly:
- The PLoS ONE 2015 study on cationic peptide adsorption contains the full HPLC recovery data for mastoparan X, melittin, and magainin 2, plus the presaturation release experiments.
- The ultra-low-binding microplate study provides comparative recovery data across plasma-treated and standard polypropylene surfaces for multiple model peptides and proteins.
- The peptide corona formation study on polyethylene offers the computational and experimental basis for sequence-dependent adsorption predictions.
- The Evosep chemical proteomics method page covers optimized handling protocols specific to LC-MS sensitivity troubleshooting.
Sources
- Adsorption of Cationic Peptides to Solid Surfaces of Glass and Plastic (PLoS ONE, 2015)
- Peptide corona formation on polyethylene surfaces: combined computational and experimental study (JPCB DOI)
FAQ
Is Ozempic a Synthetic Peptide?
Yes. Ozempic’s active ingredient, semaglutide, is a synthetic peptide analog of GLP-1, engineered with modifications that extend its half-life compared with the natural hormone. Like other peptides, it’s still subject to surface adsorption effects during laboratory handling, storage, and dilution.
Are Peptides Polymers?
Yes, in a chemical sense. Peptides are polymers of amino acid monomers linked by amide (peptide) bonds, which is exactly why their adsorption behavior on plastic surfaces resembles other polymer-surface interactions studied in materials science, including the hydrophobic and electrostatic mechanisms covered above.
What Shouldn’t You Mix With Peptides in the Lab?
Avoid mixing dilute peptide solutions with detergents or lipids late in a protocol if you’ve used a presaturation strategy, since that can release previously adsorbed peptide and distort your apparent concentration, according to adsorption research on cationic peptides. Also avoid untested carrier proteins like BSA in any assay that quantifies total protein content, since the carrier itself will confound the readout.
How Do Peptides Get Lost to Container Surfaces During Handling?
Peptides adsorb to glass and plastic through hydrophobic interactions with nonpolar plastic surfaces and electrostatic attraction to negatively charged glass silanol groups. The fraction lost depends heavily on peptide sequence, concentration, and the wetted-surface-to-volume ratio of the vessel, with losses reaching 90% or more for some cationic peptides under standard handling, per PLoS ONE.
Does Using LoBind Tubes Guarantee No Peptide Loss?
No. LoBind and plasma-treated ultra-low-binding plates meaningfully reduce adsorption for many peptides, and one study found recovery improving from about 20% to nearly 100% at low nanomolar concentration on plasma-treated microplates. But no single surface works equally well for every peptide sequence, so empirical recovery testing is still the only reliable way to confirm performance for your specific peptide.
Recommended
This article summarizes published research for informational purposes. Products sold by Neo Lab Peptides are for laboratory research use only and are not intended for human or animal use.